When you want to design an embedded project, or a plain electronics project, there are various issues to solve. It’s not only the logical design of a microprocessor code or the schematic of an electronics design. You also need to solve practical issues. You must plan how to set up a prototype or a test for a project.
With the help of an “All-In-One” coding lab, like the one from Totem Makers, it will help you to structure, build and code a prototype safer and faster. In this article, we will present the MiniLab from Totem and how it will help you in a more practical way to build up your project.
The philosophy of the MiniLab is to collect functions into a practical unit, that is easier and more comfortable to work with.

Comfortable working with electronics and breadboards
The first thing about the MiniLab is that the rack presents the breadboards and the lab electronics in a 45-degree dashboard. This eases the overview of your design and is more comfortable than if the breadboards and other parts are placed flat on the table. The MiniLab has the IO pins and power supplies placed close, just above the breadboards.


Breadboard unfriendly components
Another issue when building prototypes or when you just want to test out a code for a project, is to connect certain electronic components to your Arduino. Sometimes this is a bit difficult and prone to connection faults and irritation, because many components don’t fit well into a breadboard.

Popular electronics circuits and components
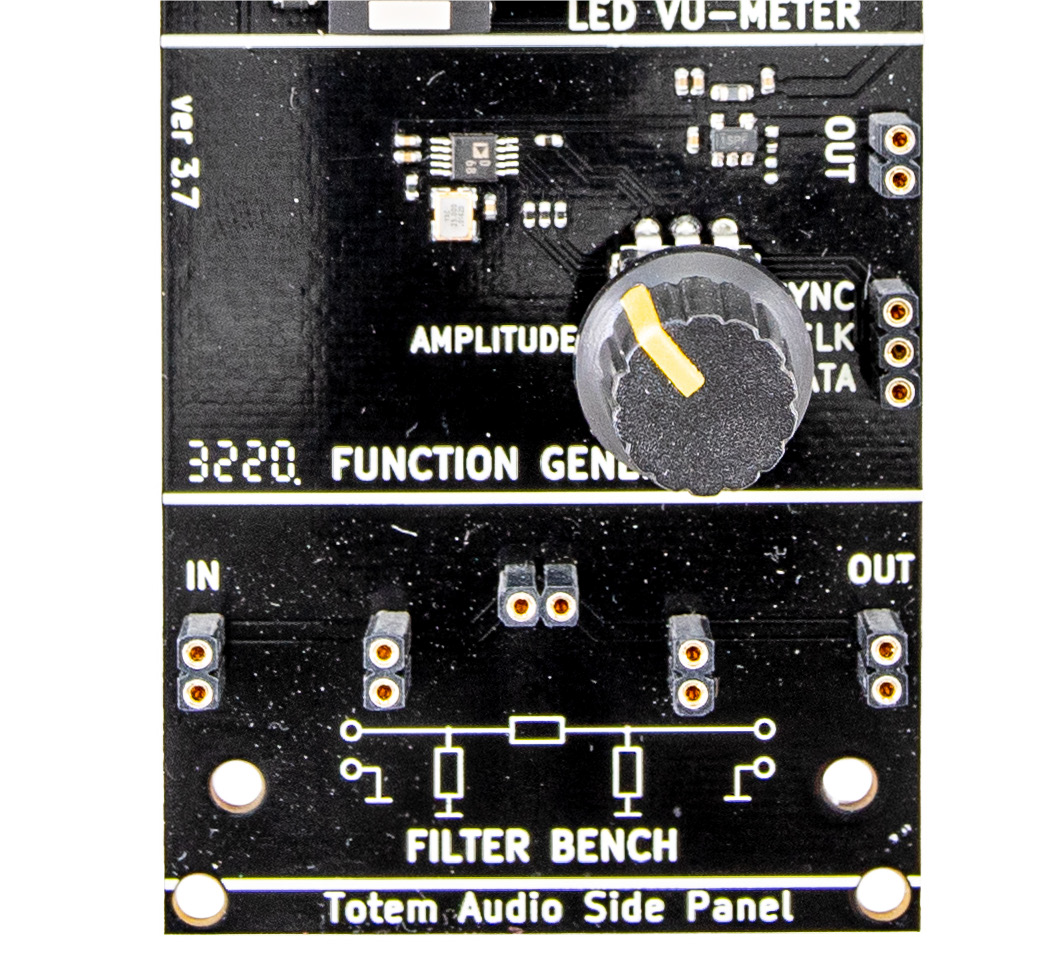
When building or testing electronics and coding with breadboards, you often want to save time for deeper diving into coding for a certain project. Then having a collection of sub-circuits of electronics functions will help you. The side panels feature several frequently used functions. There are audio circuits, like function generator and amplifier with loudspeaker. Other Side panels feature input devices like potentiometers and switches, relays and DC motor drivers. There are also LED drivers and an OLED display. All these sub-functions are often used in typical projects. You don’t always want to build them again, and these circuits will clutter your breadboards and can often malfunction if they lay cluttered around with cables attached.
An experiment using the AD9833 Function Generator
The frequency generator is controlled by the ARDUINO with 3 IO pins. We have called it SPI interface in the ARDUINO code (Serial Programme Interface).

We will use the included audio amplifier to get some higher amplitude from the frequency generator. For this we simply turn up the volume to maximum on the potentiometer. If you want to listen to the signal, insert the jumper on the headers called “SP ON” just above the speaker to the right.
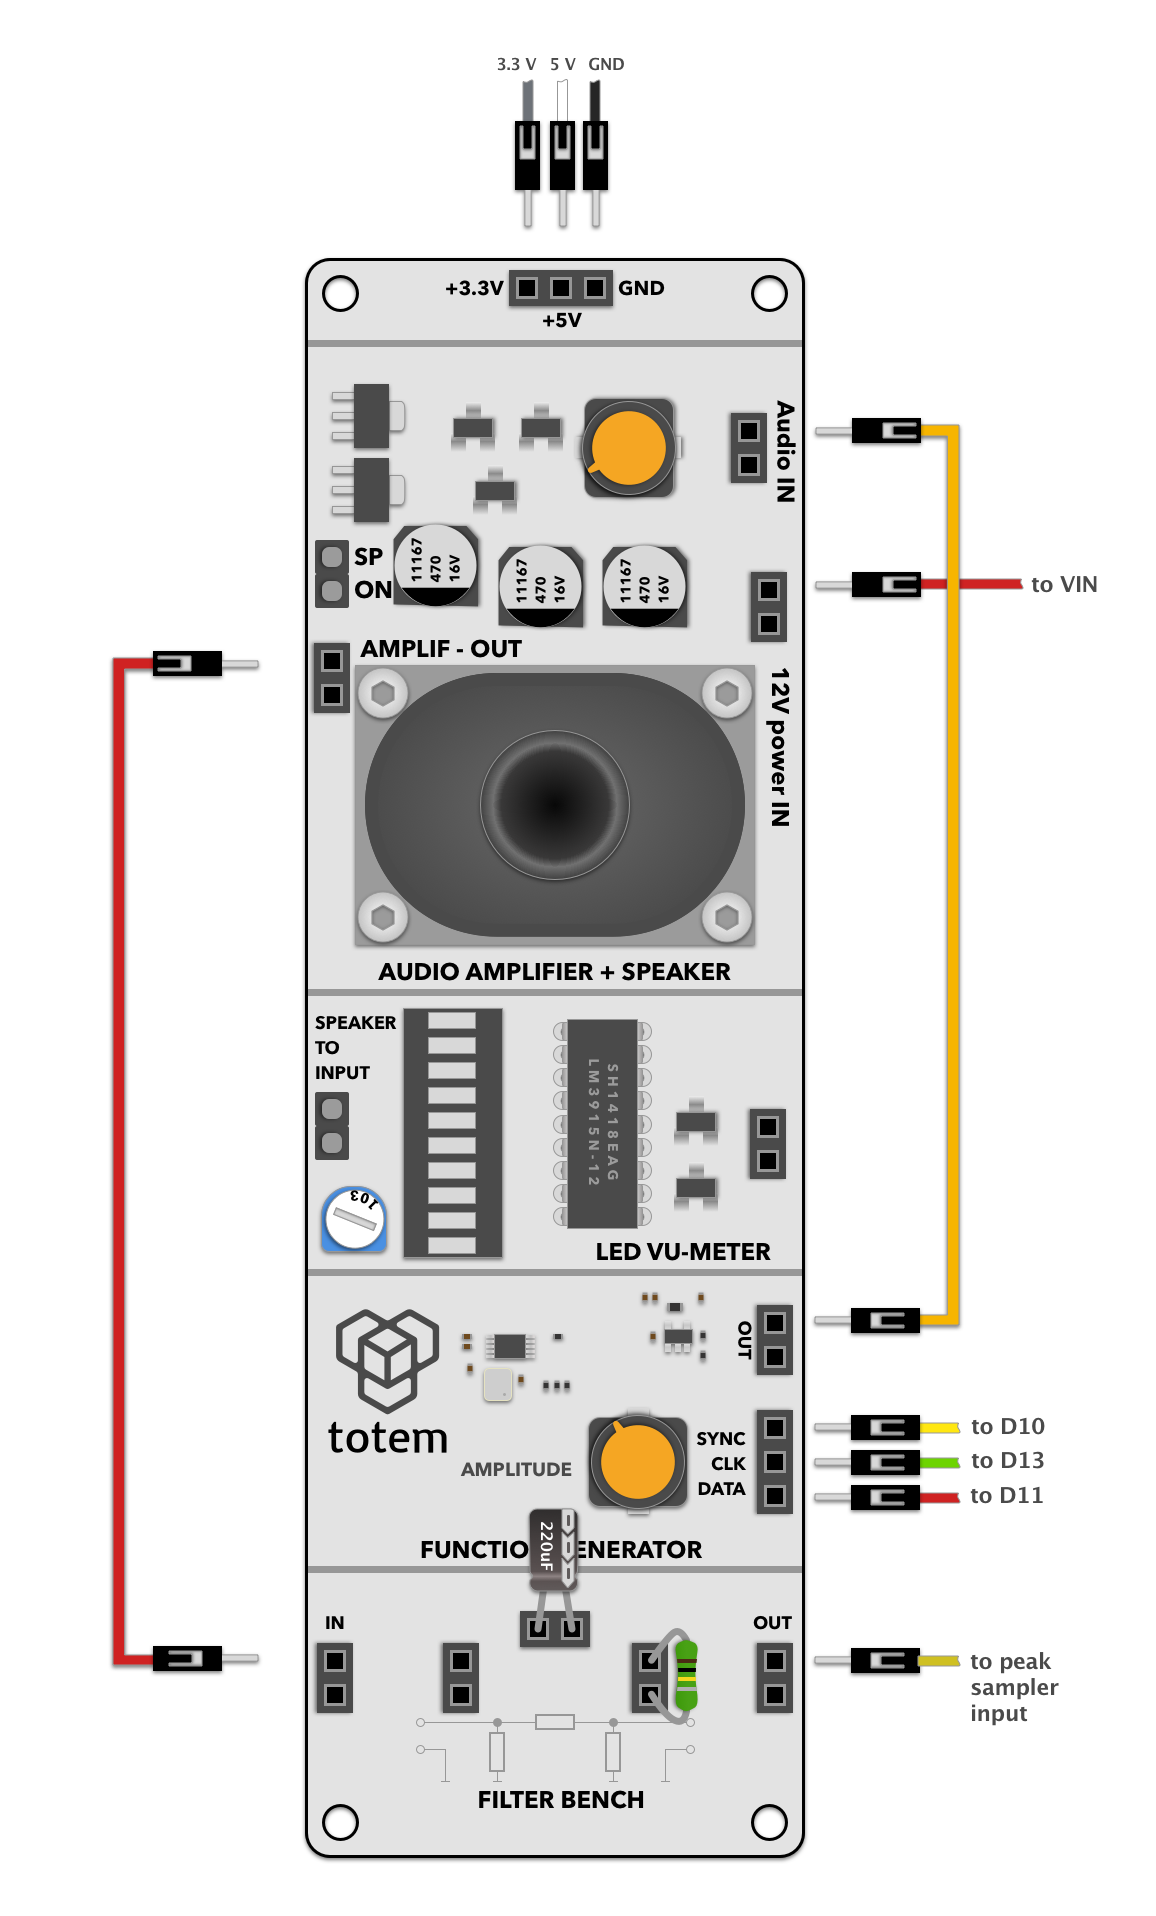
Then the sinus wave is sent to the amplifier input, and again amplified output is connected to the “Filter bench” in the bottom of the Side Panel. The output from the filter is connected to circuit on the breadboard called a peak sampler.
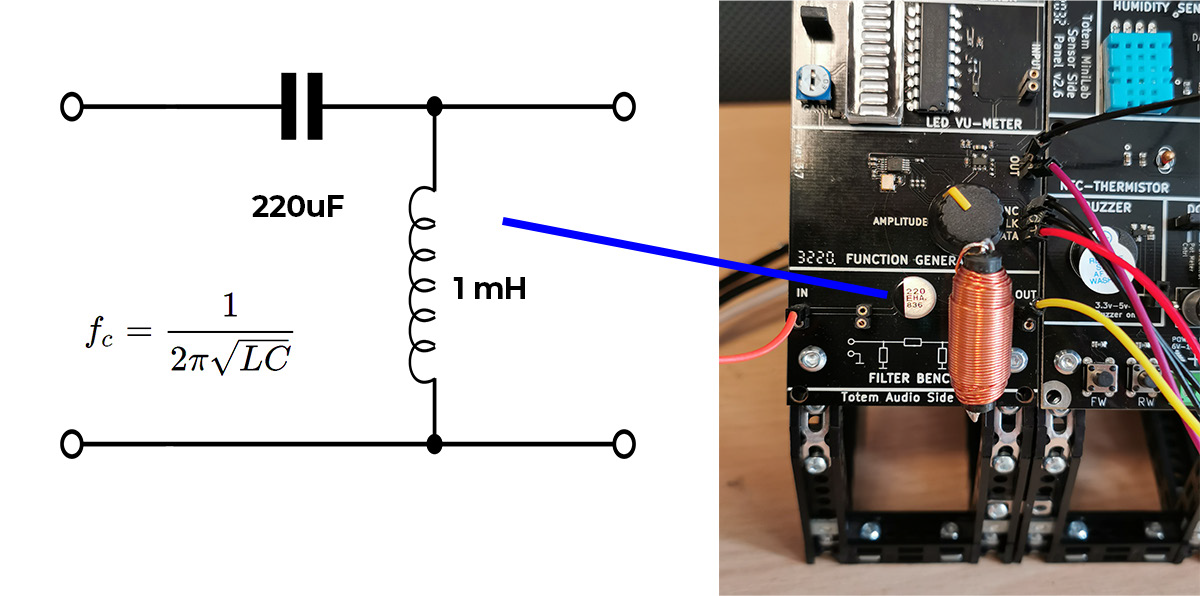
Testing the cutoff frequency of a simple high pass filter
The experiment we will show here will use the function generator to output a sinus signal to a simple highpass LC-filter. Since we will measure only standing waves, there is no need to match the impedances. The filter will not be useful for transient signals, and is here only used for simplicity, because what we are after is the cut-off frequency. You will maybe want to test more practical filters, with proper impedance matching and other properties.
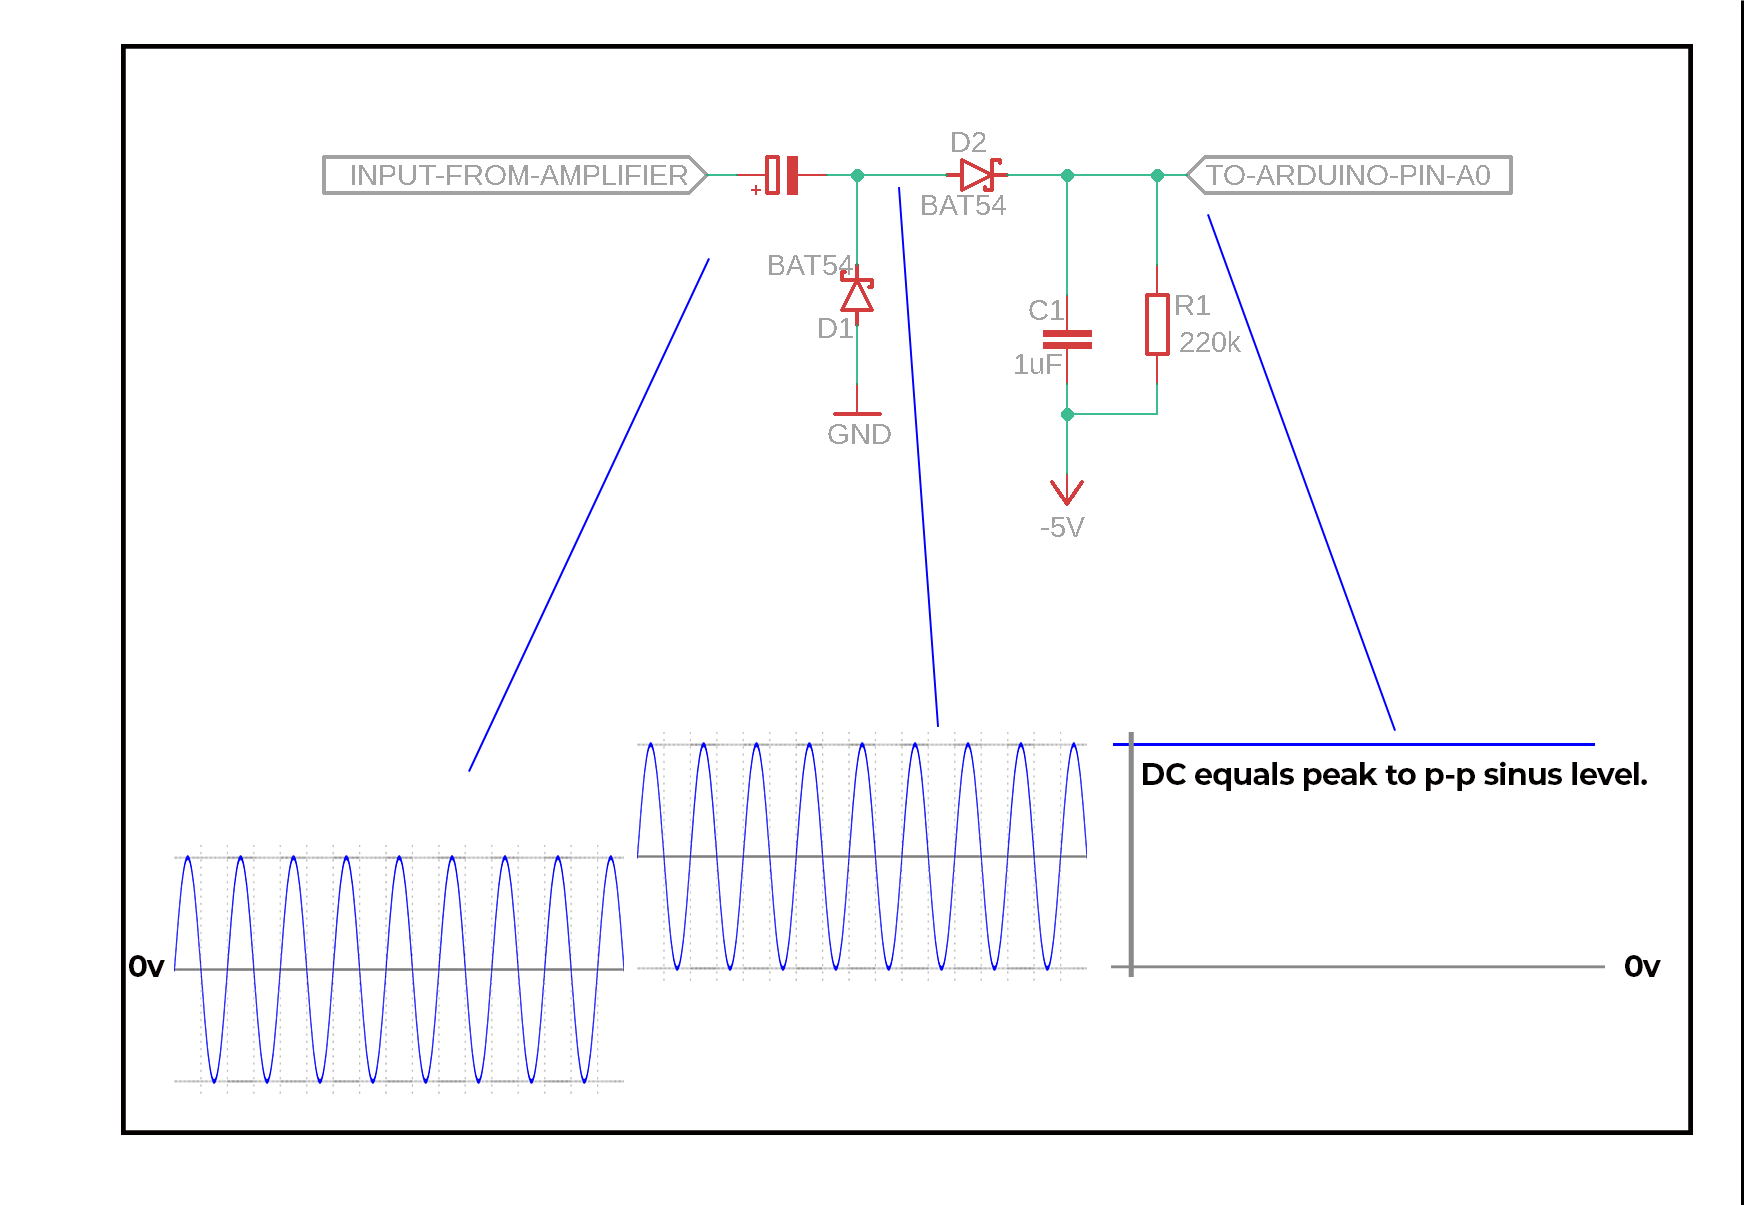
When measuring sinus waveforms, the best is to rectify the waveform and make a smooth DC-like voltage that the ADC in the Arduino can measure accurately. We are therefore using a small circuit called a peak sampler, together with a clamping diode. The clamping diode makes sure that the sinus before the peak sampler diode rises above zero volt. And the peak sampler holds the DC level at the top of the sinus wave. The DC level is now a good measure of the amplitude of the sinus signal.
The complete measurement setup

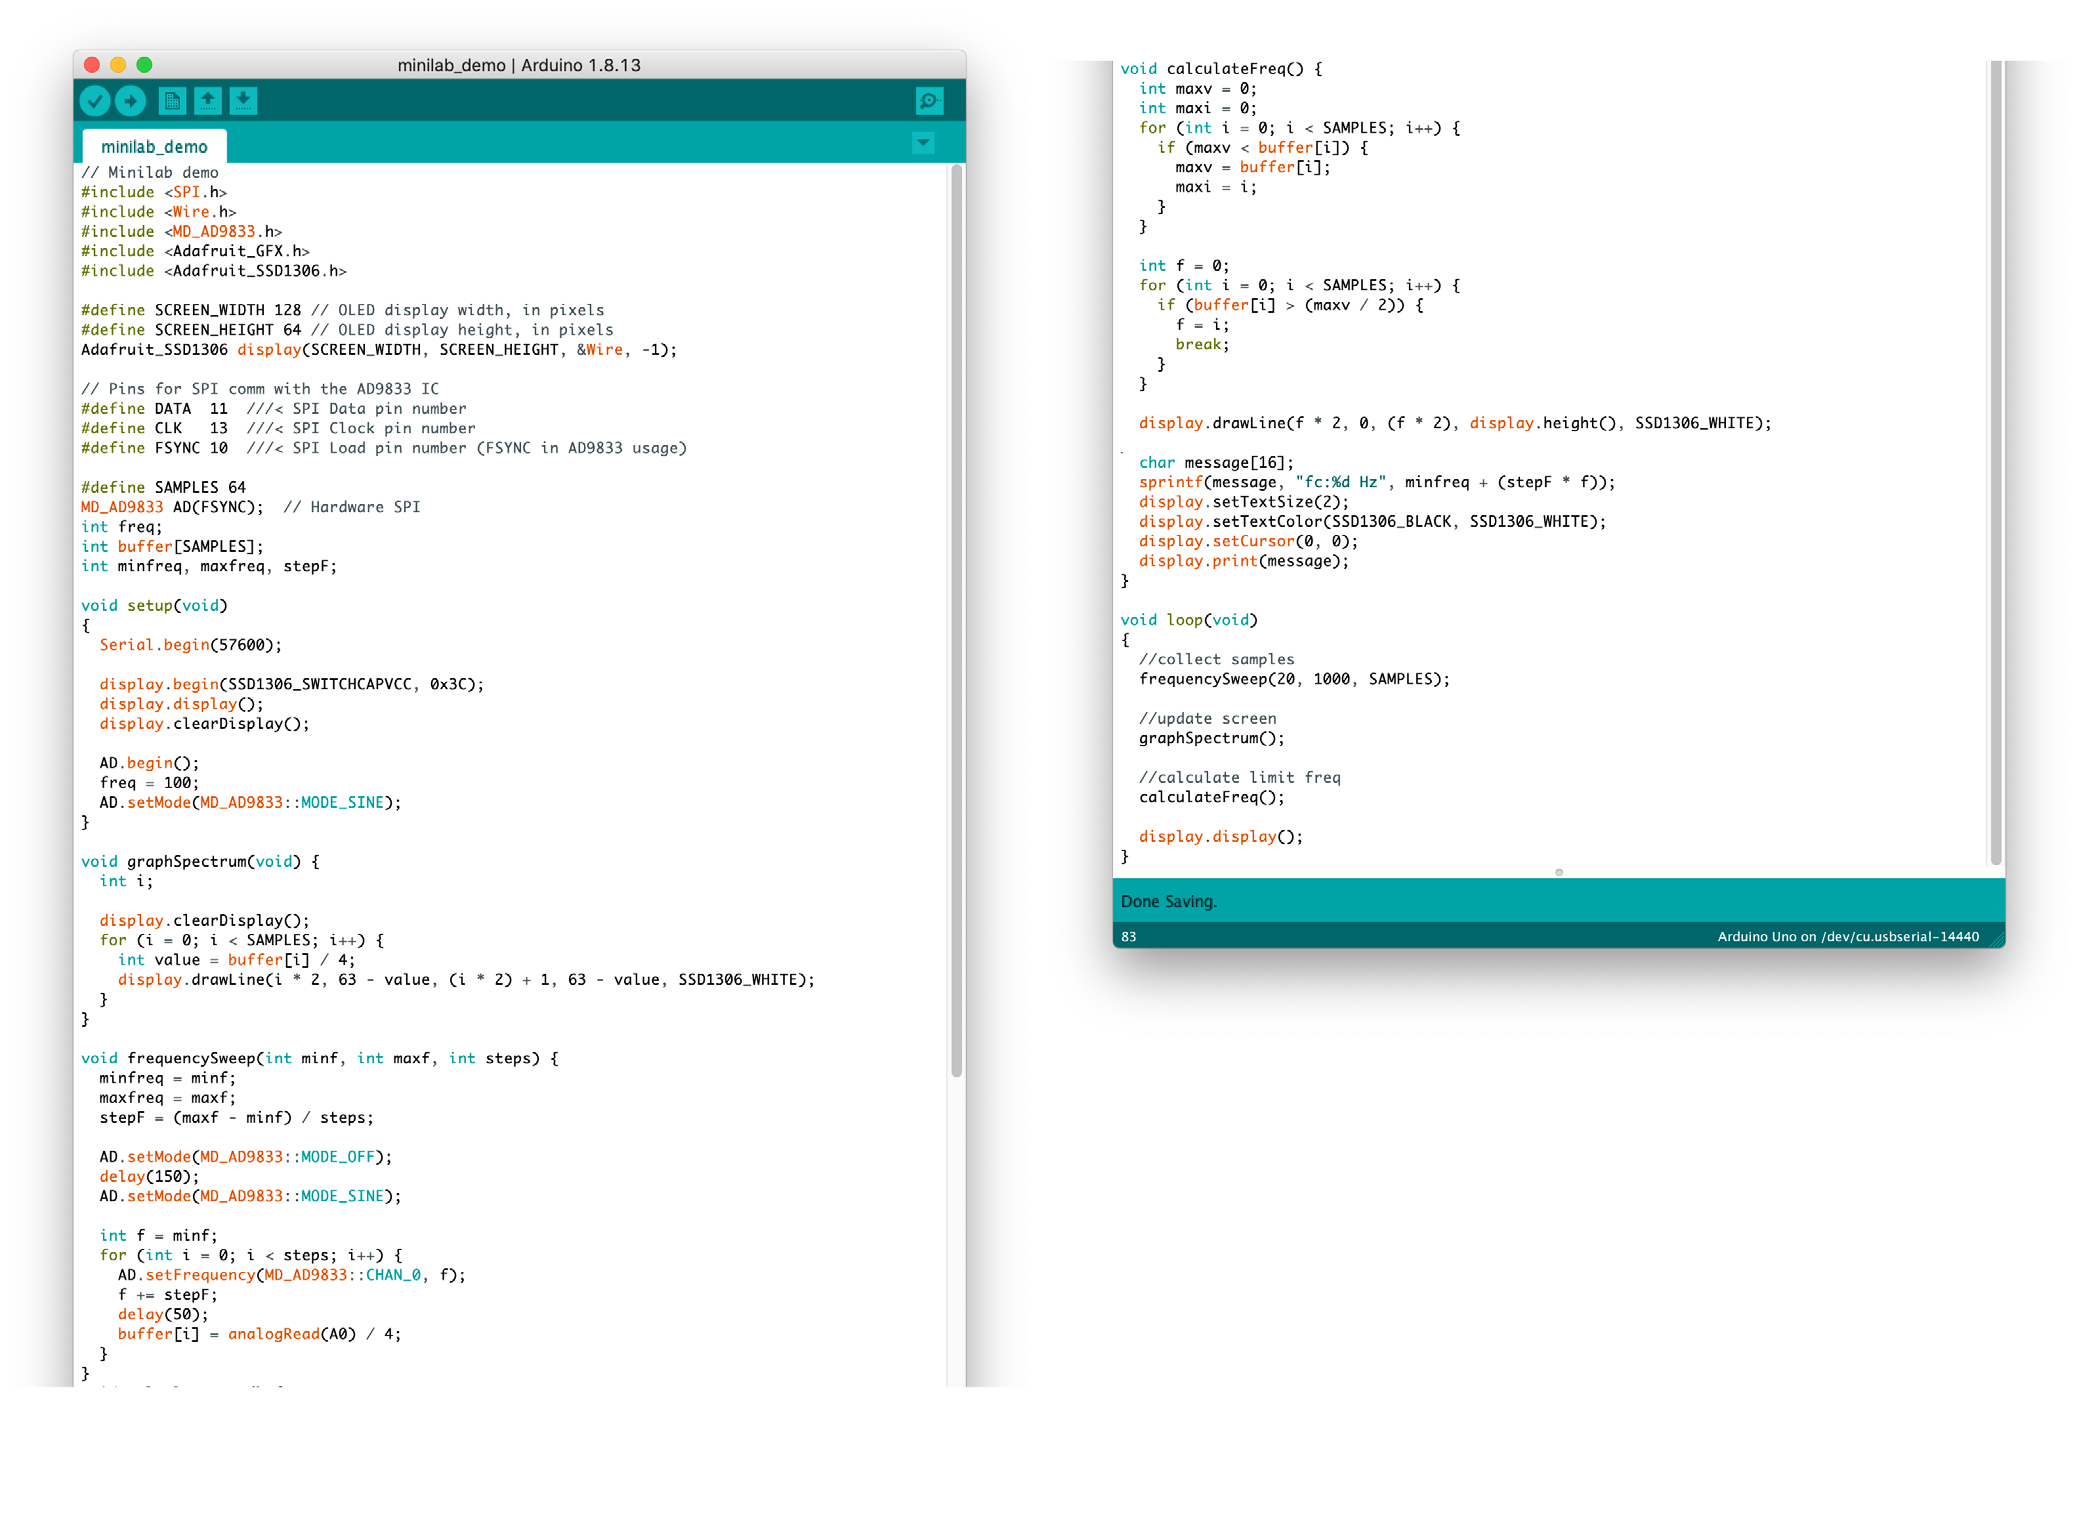
The sketch for the ARDUINO
The sketch is running the measurement test automatically. It uses some libraries for the Side Panel functions, such as SPI.h for 3-wire serial communication with the AD9833 Frequency Generator and Wire.h for I2C serial communication. Then the library MD_AD9833.h for the AD9833 chip. The 128×64 pixel OLED display uses Adafruits libraries to draw and write onto the display with Adafruit_SSD1306.h and Adafruit_GFX.h.
The code shows how easy it is to use the different modules in the Side Panels, and most of the code is about the frequency sweep, measurements and display of the result.
Showing the result on a display
The results of the frequency sweep are shown on an OLED display on Side Panel 2. Each measurement is stored a data array and traced as pixels on the display. Then the cutoff frequency is calculated and written out. The display is controlled by the ARDUINO by the I2C bus. The ARDUINO uses the Wire.h library for the I2C communication, IO-Pins: A4 (SDA), A5 (SCL).
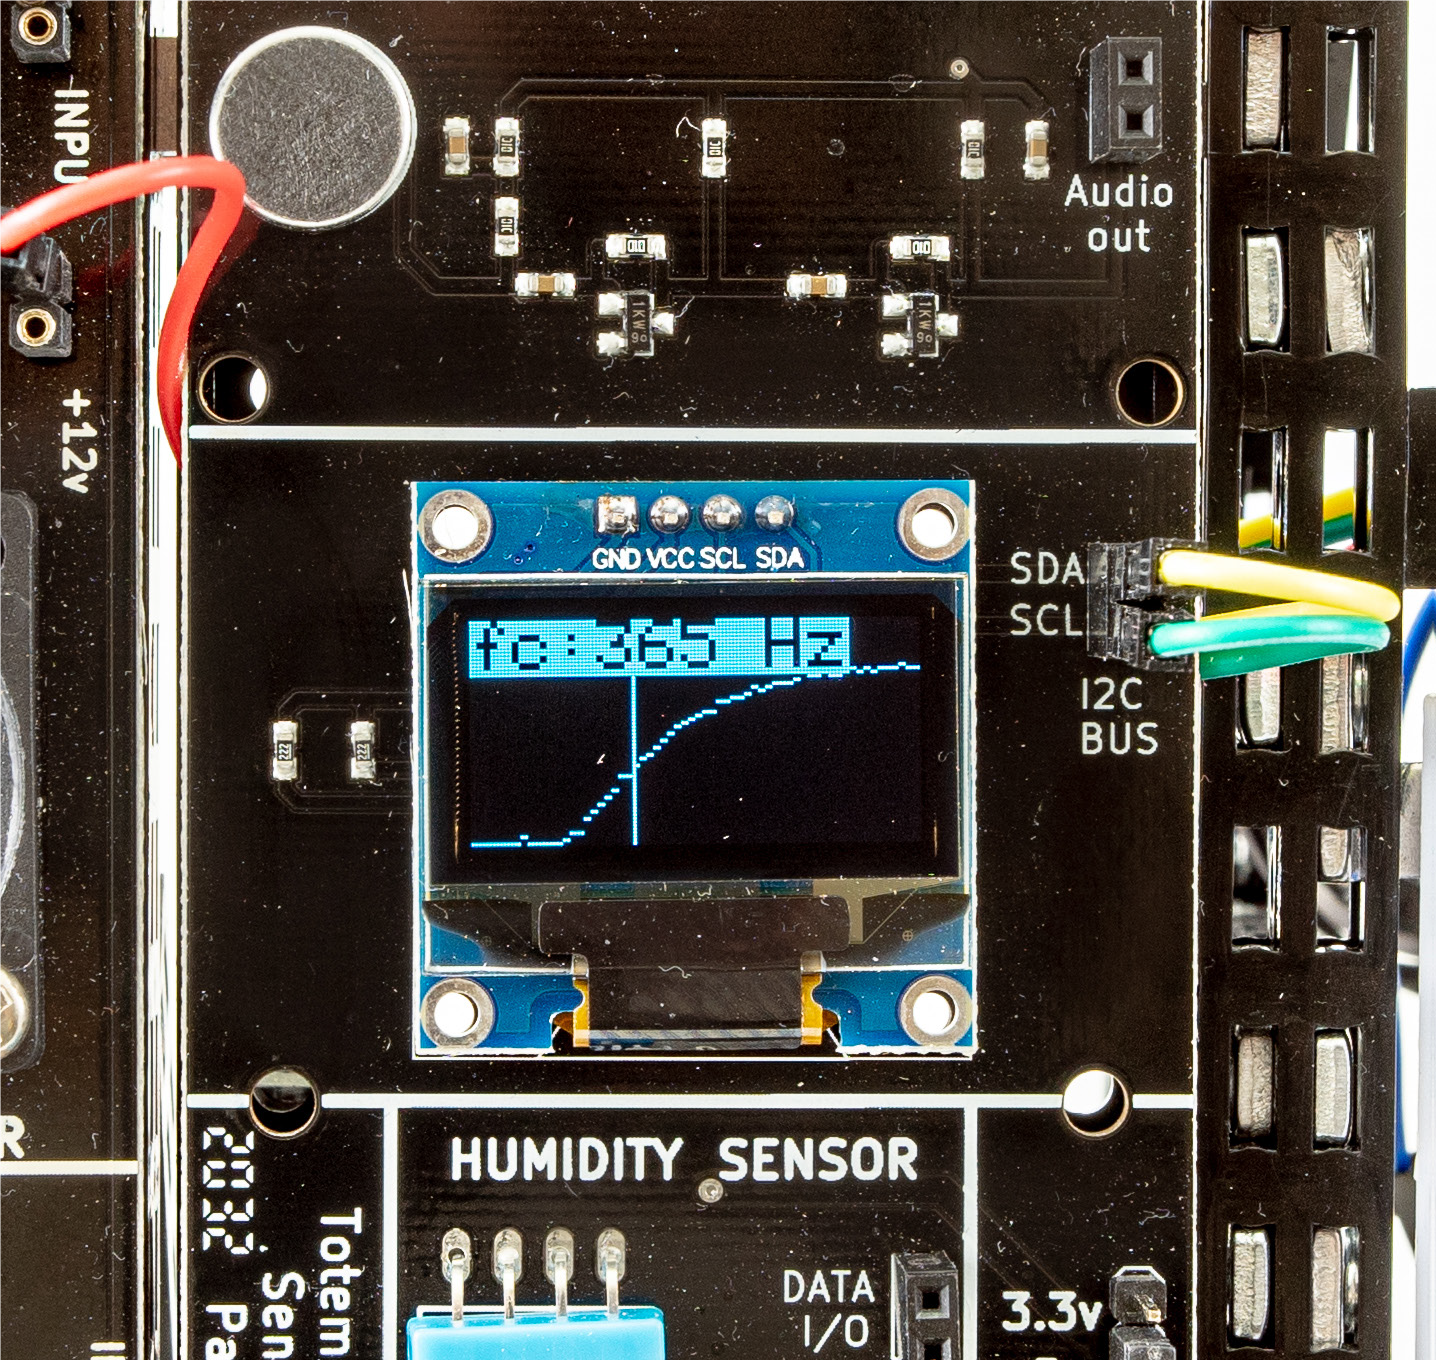
The actual result for the cutoff frequency
When we ran the test with our chosen components, the result was as you can see above 365 Hz. The theoretical was 340 Hz. We measured the component values, and could see that especially the capacitor was off the nominal. It was measured to be 187 µF instead of µF 220. So, the result was close, since the theoretical cutoff frequency was then to be 368 Hz.
All in all, it shows that with simple methods, the ARDUINO can be used for automated measurements of simple circuits.
he LC filter we used in this setup was really just something we found in our component drawers. And to use the small OLED as output is of course not very informative.
The LC filter we used in this setup was really just something we found in our component drawers. And to use the small OLED as output is of course not very informative. It is easy to expand this sketch to send the results back to the PC, and have a better screen to show the graphs. We have just shown a simple example here, and it’s up to you to be inspired to improve on such experiments.